How To Create Specification Charts For Products In Shopify

A specification chart, also known as a product specification sheet, is a type of diagram that illustrates the various specifications of a product. When you neatly and dynamically display product data (including product fields, variant fields, and meta fields), your customers to find the information they need to make a purchase, right on your site, this will bring more convenience to your customers when they visit and shop at your store page. With the application that I will introduce later, the Easy Specification Charts app, you will have no more losing customers to your competition, you can keep them right where you want them, on your site, and ready to buy.
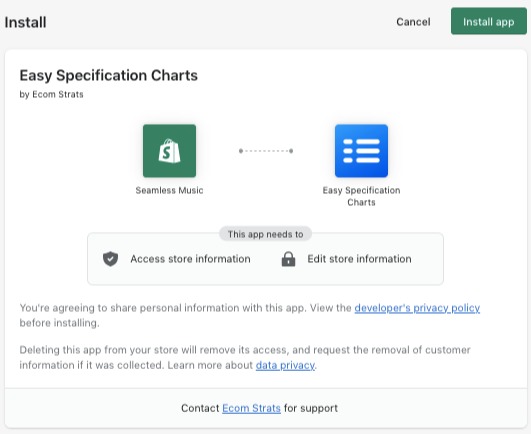
Everything you need before setup is to log in to the Shopify app store, search and install the Easy Specification Charts app.
Step 1: Set up
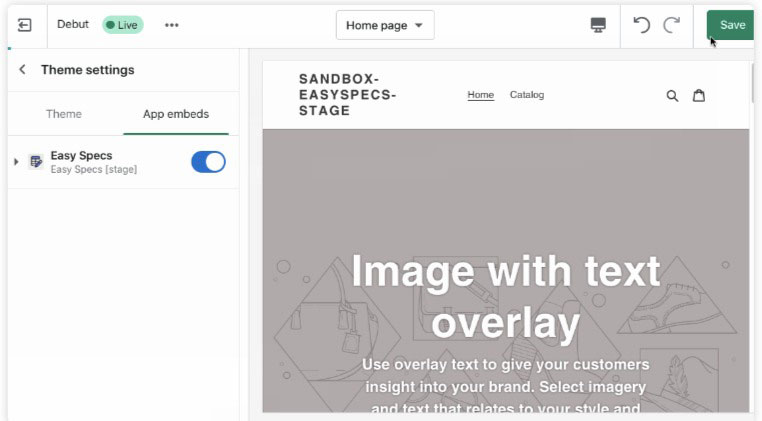
In order to get set up with Easy Specs you’ll first need to enable it on your theme.
- Go to Online Store > Themes.
- Press the Customize button on the Theme you want to use.
- Select Theme Settings, located on the bottom left of your screen.
- Select the App Embeds tab.
- Toggle Easy Specs to enable and Save
Step 2: Pick chart placement on your product page
Next, you’ll need to decide where on your shop’s product page you would like your charts to be displayed.
- Go to the Settings tab and click the Location Picker icon.
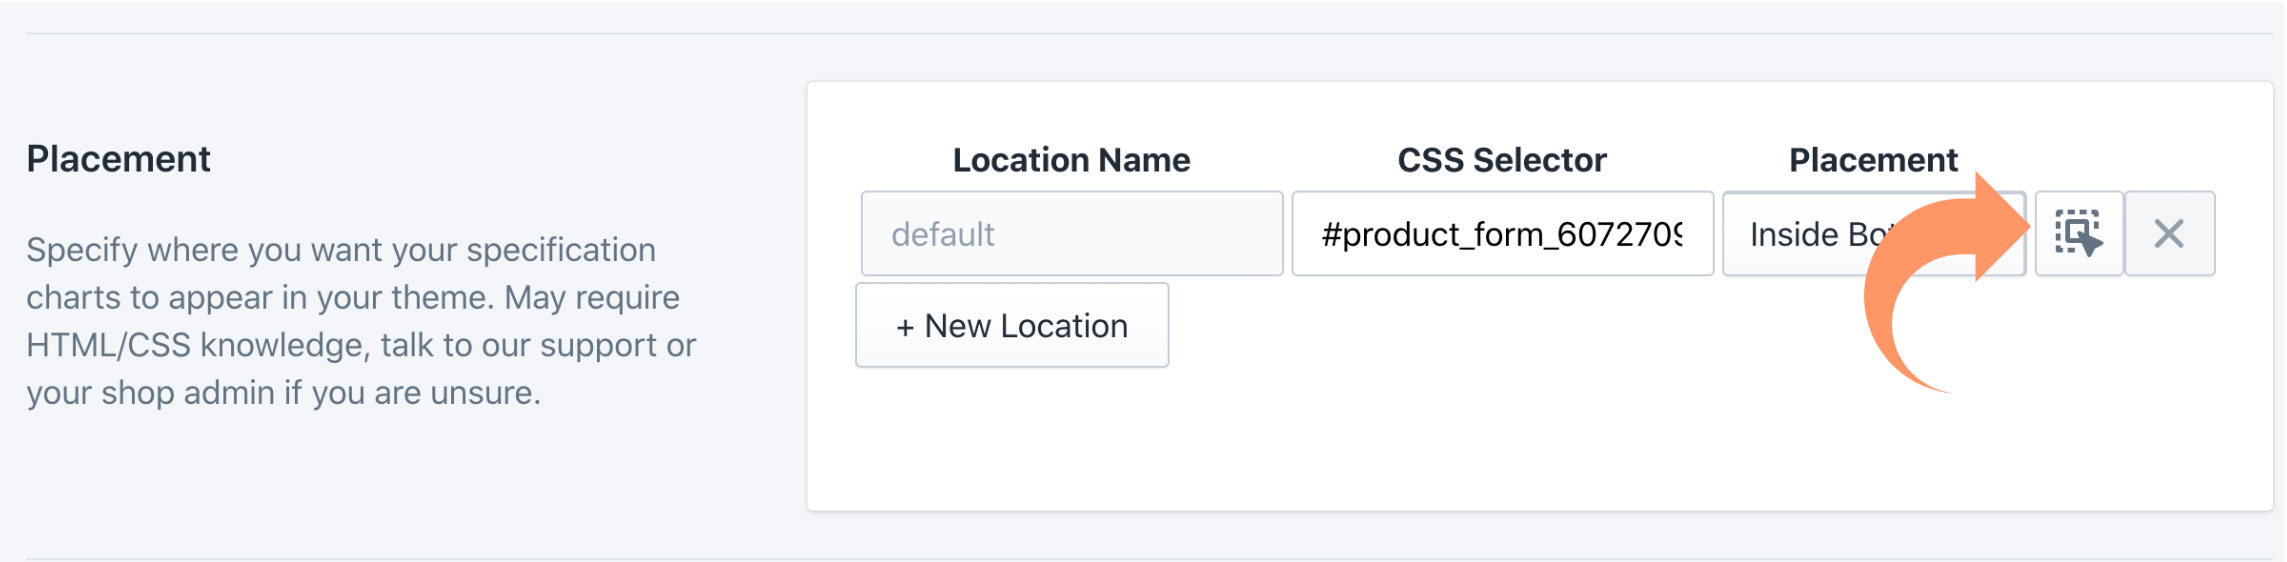
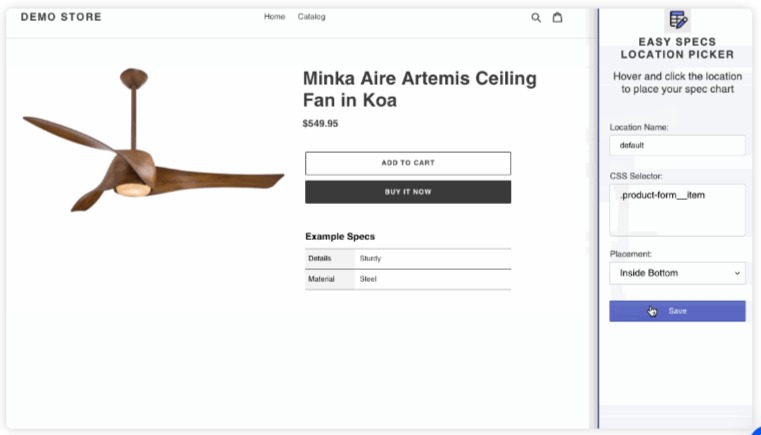
- Once the Location Picker Tool opens, click anywhere and a preview of the chart will appear.
- You may also use the placement dropdown to move the chart in relation to the selected element.
- Once you’re happy with the chart location, press Save
Step 3: Construct the chart template
The power of Easy Specs is that single charts can be applied to groups of products. To accomplish this each chart pulls product data from a Shopify field. Some of these fields are already defined, Price, SKU, Vendor, etc. Others may be custom, for which you should use Metafields.
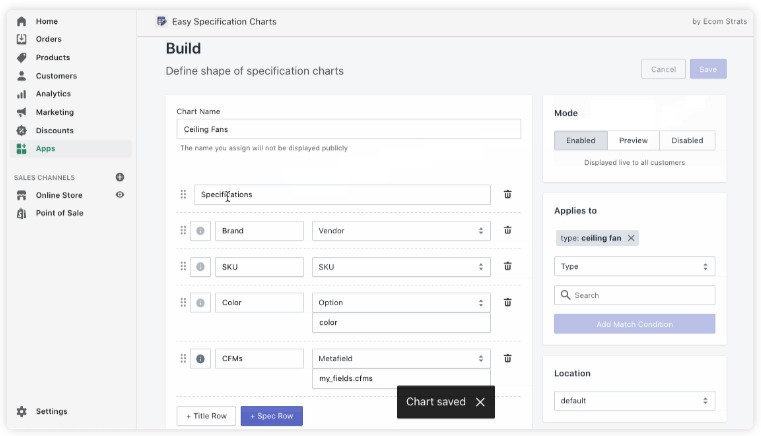
Build a new Chart Template
To create a chart go to the Dashboard tab and click the Build Spec Chart button or go to the Build tab.
- Name the Chart: The chart name is private. It is a label for the charts you create; the customer will not see the chart name. For this example, I will label this chart Ceiling Fans to know which product type this chart applies.
- Build the Chart Rows: Fill out the Section Title. Many store owners will default to Specifications as the first Section Title, so let’s input that. For the Spec Rows, the left column is the Spec Name, and the right column is the Spec Source. Let’s start by filling out the Spec Names with the information that listed in the chart planning phase.
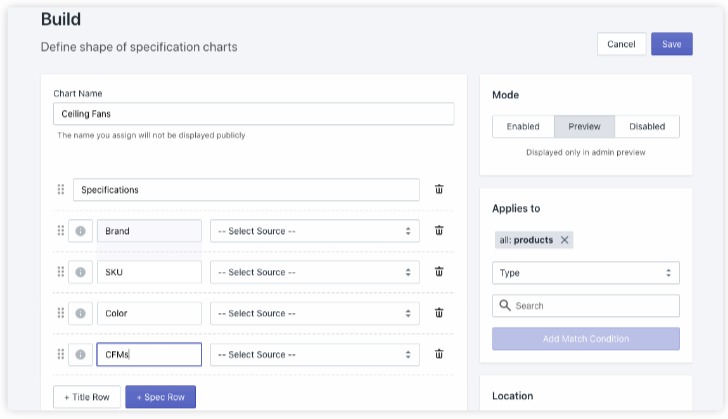
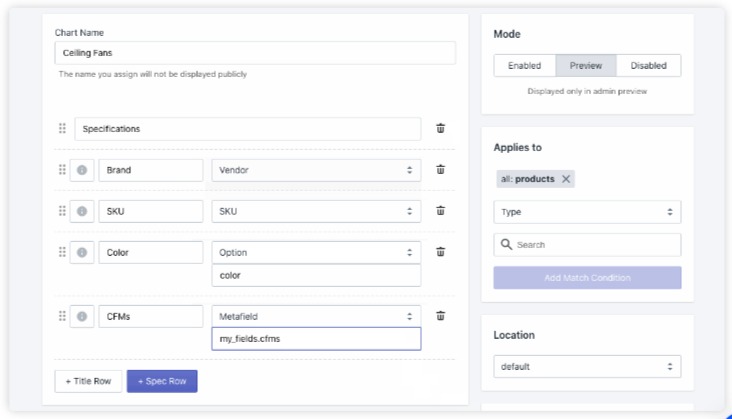
– Brand is an existing field, so let’s select Vendor from the source dropdown.
– SKU is also an existing field, select SKU from the source dropdown.
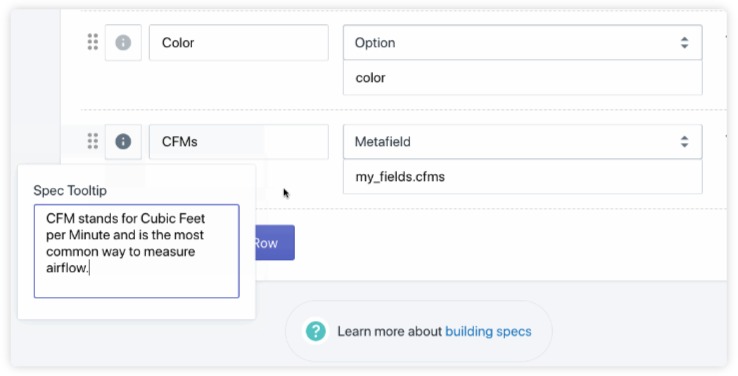
– Color is a variant option, select Option, and type in the option name defined on the product, color.
– CFMs are a piece of custom data stored in a meta field, select the Meta field and type in the meta field namespace and key. In this case my_fields.cfms.
- Adding Tooltips (optional): A tooltip is a helpful message to describe details about a specification. Once defined, tooltips are rendered as an info icon next to the spec name and displayed on mouse hover. A good use of a tooltip is for clarification of a specification’s meaning. For this example, customers may not know what CFMs are, so we will help them understand by providing more information.
To Create a Tooltip: Click the (i) icon next to the desired specification. Once the prompt opens, type in your tooltip message. When done, click outside of the textbox, it will close but the text will remain. The tooltip icon will turn from a light grey icon to a dark grey icon, meaning it is active. To remove a tooltip, simply delete the text within the tooltip text box.
Step 4: View the chart appearance on your shop
Choose your Mode. The chart mode defines how the chart should be displayed.
- Enabled – Displayed to everyone.
- Draft – Displayed only to admin users. Invisible to customers.
- Disabled – Not Displayed to anyone.
Once you decide to enable your chart, it will be published in the shop for everyone to see. Watch your conversion rate increase.